In previous posts, I’ve discussed how our Giving Game program is growing quickly. This post will examine that growth more closely, providing numbers on the key indicators we’ve been tracking since the inception of our Giving Games.
Introduction
There are many different types of Giving Games, and it doesn’t make much sense to lump together hour-long discussions with two-minute conversations. So we sort Giving Games into three broad categories: Standard, Mini, and Online. (Our What is a Giving Game page provides examples of each category.)
Standard Giving Games
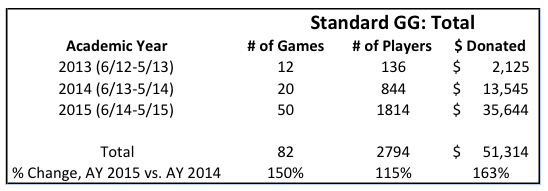
Standard Giving Games are our bread and butter, and our most important category. We obviously prefer to engage with participants for as long as possible, and Mini and Online (with a few exceptions) Games have very short interactions.
Over the last year, we more than doubled the number of Games, participants, and money donated relative to the previous year.

The growth in participants is particularly impressive given that in 2013-2014, roughly 40 percent of our participants came from Peter Singer’s Practical Ethics course at Princeton. Although this course only runs every other academic year, our organic growth still showed tremendous growth in Giving Games outreach this past year—even without a Practical Ethics course in 2014-2015.
Mini Giving Games
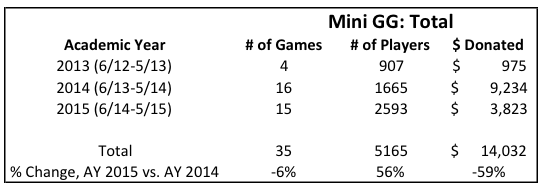
Last year there was one less Mini Giving Game than the previous year, yet the number of participants grew by more than 50 percent. In addition to reaching more people, we became more cost-effective in our efforts.

In 2014-2015, we kept things simple and discontinued some relatively costly—and only moderately successful—Mini Giving Game formats such as our “Giving Experiment” video. As a result, we were able to reach more people through our overall Giving Games outreach efforts while spending much less money in the process.
Our growth in this area was not as strong as we would have liked, but we’re optimistic it will rebound going forward. A key driver behind our muted growth was that Giving What We Can chapters largely abandoned the Mini Giving Game format in 2014-2015. We plan to take a much more active role in encouraging these chapters to use this format (and other Giving Game formats) over the coming year.
This could be a significant driver of growth going forward, particularly given how many new Giving What We Can chapters are forming.[1]
Online Giving Games
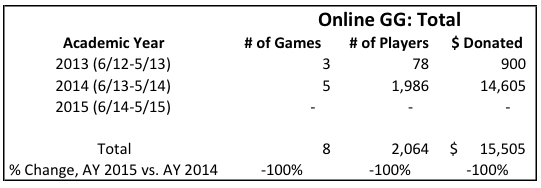
We started two online Giving Games toward the end of 2014-2015, but both remain ongoing and will be included in our 2015-2016 numbers. These two Games reflect our new approach to this version: we don’t want to invest a lot of time, energy, or money creating new online Games with modest reach, but when opportunities present themselves, we want to take advantage of these outreach opportunities. In this case, opportunities took the form of Peter’s new book and a MOOC he’s teaching on effective altruism.

Going forward, we’ll continue to opportunistically run online Games while looking to develop partnerships with platforms that already have significant online traffic. Our goal is to create a world-class online Giving Game with the potential to reach hundreds of thousands or millions of people.
Funding Mix
2014-2015 saw a marked shift away from The Life You Can Save as a source of funding for Giving Games. Over 60 percent of the money donated last year came from outside sources.

Going forward, we expect funding needs from both The Life You Can and external sources to rise as we continue to grow. The funding mix will largely depend on the relative growth rates of different models: corporate Games typically receive significant external funding, while campus-based Games generally require a full subsidy.
Thoughts on future growth
Giving Games are clearly growing at a fast pace. But what do we expect growth to look like going forward?
Over the long-term, we know growth rates will fall. Doubling each year in perpetuity isn’t possible.
If we just consider the next few years, however, it seems reasonable that we could maintain, or even exceed, our current growth. There are several factors we believe will help support such growth:
- The overall growth of the effective altruism movement should provide a significant tailwind. Several high profile books about effective altruism were released in 2015 and are only in the early stages of their influence. New effective altruism chapters should continue to be a strong source of growth.
- Giving Games will be better staffed. Last year, I reduced the amount of time I spent on Giving Games due to taking on significant other responsibilities at The Life You Can Save. With Rhema Hokama having recently joined our team full-time, I’m now able to spend more time on Giving Games. We’re also making good progress in getting volunteer help for this project.
- We’re just scratching surface with business development opportunities. We’ve done very little in terms of mass outreach to potential Giving Game organizers (e.g. sending mass emails to hundreds of philosophy teachers asking them to incorporate a Giving Game into their classes.) But with a growing volunteer force, we should now have the capacity to identify and reach out to numerous promising leads.
- We’ve invested in infrastructure to accommodate ongoing rapid growth. These investments have reduced the amount of staff time needed for each Giving Game. Improved resources and training materials have sped up the pre-game process, while our newly automated post-game reporting process has shaved time off the time previously required for that. Similarly, the new Giving Game Discussion Group on Facebook allows facilitators to share questions and ideas with each other, leveraging staff time.
- The “graduation effect” will naturally grow our facilitator network. This year, dozens of campus chapters will run Giving Games at their schools. As students in these chapters graduate, experienced Giving Game facilitators will naturally move on to new areas. In an example of the graduation effect at work, we recently had an easy time setting up a Giving Game at a consulting office because an employee there was familiar with the model, having facilitated several games in college.
Considering these factors and the pipeline of Giving Games we have in place, I expect that growth will accelerate modestly this academic year. My rough estimate is that the annual growth rate for Standard Giving Games will be in the 100 to 150 percent range. Mini Giving Games should grow a bit faster, probably in the 150 to 200 percent range. While these estimates are necessarily imprecise, I suspect that we’re more likely to exceed the estimated ranges than to undershoot them.
[1] If we exclude all Games run by Giving What We Can chapters, the number of Mini Giving Game participants grew from 924 in 2013-2014 to 2,458 in 2014-2015—a 166 percent growth. We believe continued growth from these other sources, combined with a rebound in interest from Giving What We Can chapters, will lead to accelerating growth in 2015-2016.


