2025
Annual Report
table of contents
*All dollar ($) amounts specified in this report are United States dollars unless expressly indicated otherwise.
LETTER FROM THE CO-CEOS
A Renewed Commitment for a New World
Dear The Life You Can Save community members,
2025 will go down in history as one of the most turbulent years global development has ever faced. The sweeping cuts to foreign aid implemented by some of the world’s wealthiest nations shook the architecture of systems built over decades to protect the most vulnerable people on earth. Programs were shuttered overnight. Dedicated people were let go with no transition, no handover, no time to pass on what they had built. Much of what existed will need to be rebuilt from the ground up.
The response from donors like you was genuinely moving. You stepped forward with urgency and conviction, and that matters more than we can say.
Our Response
In the first half of 2025, we partnered with Founders Pledge and PRO to launch the Rapid Response Fund. Together, we raised $13.1 million from donors across the globe, resulting in grants to multiple programs and an estimated 4,718 lives saved. That estimate is not a small number, and it reflects what becomes possible when donors are equipped with the right information and act on it.
But emergency relief could not be the whole story. Our research team immediately began assessing the long-term consequences: updating our granting processes, deepening collaboration with peer organisations, and traveling to Kenya and Uganda to meet directly with six of our recommended not-for-profits and health leaders from multiple countries. The picture that emerged is one of a sector adapting rapidly, with fewer resources forcing more collaboration and innovation. The result of this work has been recently published as our first-ever Health Sector report, and our team is already replicating this approach for the other sectors that are part of our focus areas.
In 2025, our research team also completed the re-evaluation of all recommended not-for-profits for the 2025-2028 cycle, with the results published in our newly launched Evaluation Hub.
On other fronts, we made substantial improvements to our donor communications, upgrading our systems and establishing a more regular cadence to share information, provide meaningful giving opportunities, and keep our community informed.
We introduced several improvements to our website, from an entirely redesigned home page to new features that make the donation process simpler. We also tested new event formats to engage our community in person and online, recognising that a stronger community makes us stronger overall.
Alongside all of this, we continued evolving our internal processes to ensure that, as we grow, we can sustain the quality and efficiency we expect from the best organisations in our sector.
Investing in Growth During a Critical Moment
We want to be transparent about something important: 2025 was not just a year of responding to crisis, but also a year of deliberate investment in our own capacity to grow.
When the aid cuts hit, we made a conscious decision to invest in the people, systems, and research capabilities needed to do this work better and at a greater scale, rather than pull back. That meant costs went up before the full benefits of those investments are reflected in our outcomes.
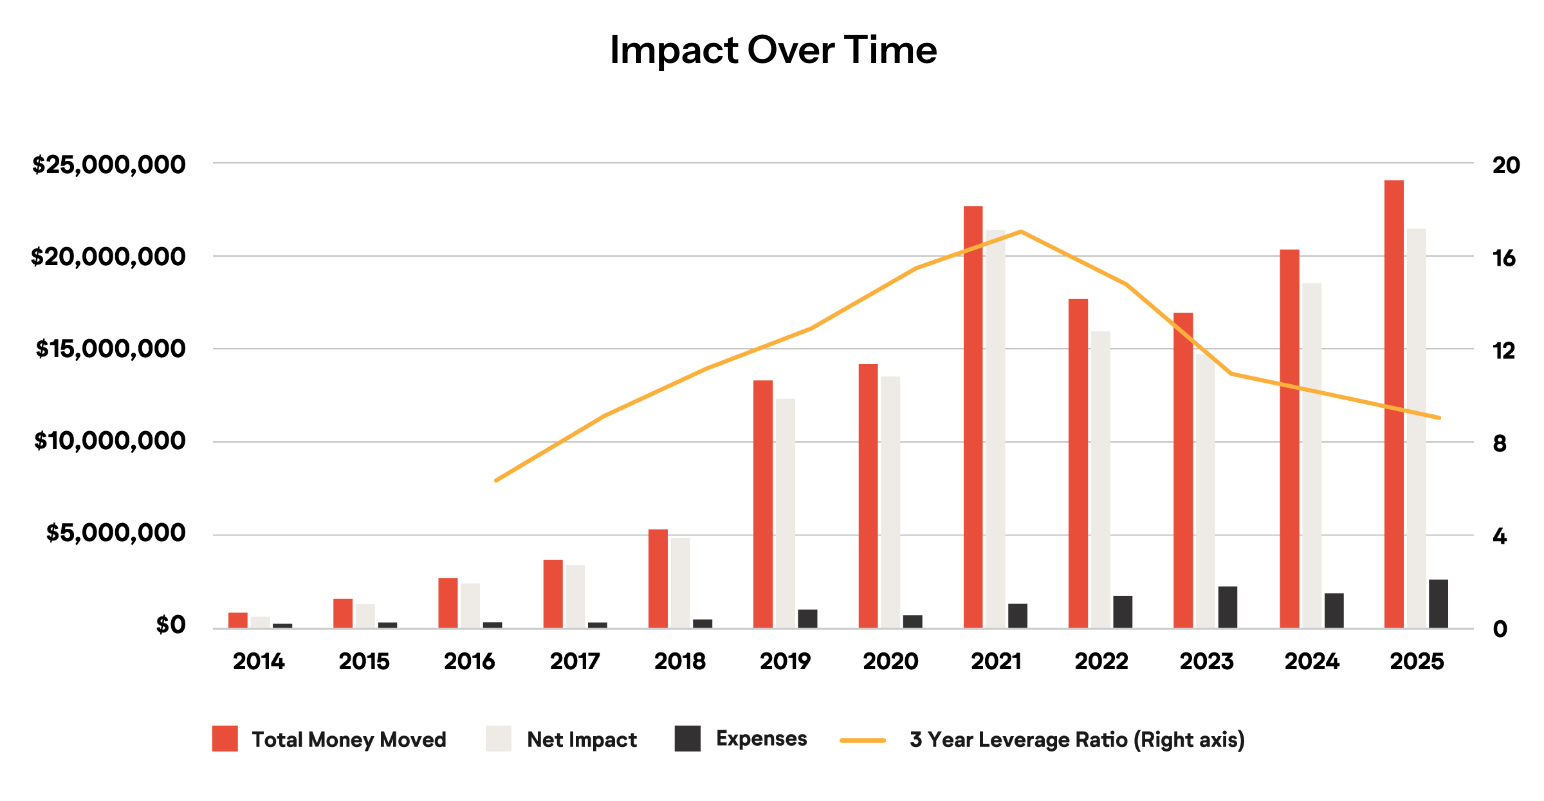
As a result, you will notice that our leverage ratio, the measure of how much impact is generated for every dollar we spend, dipped from 10 to 9.19 in 2025, a 8% shift from previous years.
This was expected, and it was the right call. Building stronger foundations takes time, and the investments we made in 2025 are already shaping what we can achieve in 2026 and beyond. We expect our leverage to reflect that as we move forward.
We raised $24.07 million in total, an 18.29% increase over the previous year. In a year defined by disruption, our community showed up, and so did we.
How We’re Evolving in 2026
Our mission has not changed: connecting donors with the most effective organisations fighting extreme poverty, and ensuring every dollar has the greatest possible impact. What is changing is how we do that work.
On the research side, we are continuously reassessing the global development landscape to ensure our recommendations reflect the best and most current evidence. We are identifying the highest-priority and most neglected areas, and translating that into new opportunities for our donors, whether through new recommended organisations, new funds, or personalised advisory services.
On the donor side, we are investing in a stronger relationship with our community: more transparency, more regular updates, and deeper insight into the impact you are making. We also recognise that some donors are ready to make larger, more strategic gifts, and we are building the capacity to support them, bringing the same rigour we apply to our charity research to your broader giving strategy.
We hold ourselves to the same standards of effectiveness we expect from the organisations we recommend, and we are investing in our own capacity to grow into this moment.
What was once a movement of a relative few, people who believed in evidence, impact, and the power of giving directed wisely, is becoming something much larger. The principles we have always stood for are being embraced by more people and institutions than ever before.
Thank you for being part of this community. Thank you for walking alongside us through one of the most complex years this sector has ever seen. We are so glad to be doing this work with you.
Sincerely,

Jessica La Mesa and Andrea La Mesa
Co-CEOs, The Life You Can Save
The Year In Numbers
| Metric | 2025 | 2024 | 1 yr % Change | Compound annual growth since 2014 |
| Net Impact | $21,448,021 | $18,511,604 | 16% | 39% |
| Money Moved | $24,065,415 | $20,345,228 | 18% | 36% |
| Expenses | $2,617,394 | $1,833,624 | 43% | 26% |
Net Impact: We measure our Net Impact by subtracting our total annual expenses from the total Money Moved to our recommended not-for-profits. In 2025, our net impact was ~$21.45 million as we spent ~$2.62 million on our operations globally and raised ~$24.07 million for our recommended not-for-profits.
Money Moved: In 2025, our supporters donated a total of ~$24.07 million to our recommended charities.
Money Moved excluding large outlier donations: The giving levels of one or a few large donors in any given year can have a significant impact on our overall results, and these donations can also be quite volatile year-to-year. We, therefore, report on both the total Money Moved and “Money Moved excluding large outlier donations” to help indicate our growth rate. We had none of these large outlier donations in 2025.
Expenses: Expenses increased from $1.80 million in 2024 to $2.62 million in 2025, reflecting a 43 percent year-over-year rise.
3-year leverage ratio: If you take all the money we raise annually for our not-for-profits and divide that number by the money we spend operating our organisation, you get what we call our “leverage ratio” for that year. To gauge our impact over time, we rely on a “3-year leverage ratio“ which is simply our average annual leverage ratio over the past three years.
From 2023-2025, our 3-year leverage ratio was 9.19:1. In other words, for every $1 we invested in spreading our message and helping others discover and donate to effective charities over the last three years, we raised $9.19 for our recommended not-for-profits. We believe our 3-year leverage ratio is a helpful representation of our effectiveness and impact. But we also believe this estimate is fairly conservative since we’re unable to track all the donations that would ideally be included in our overall Money Moved metric.
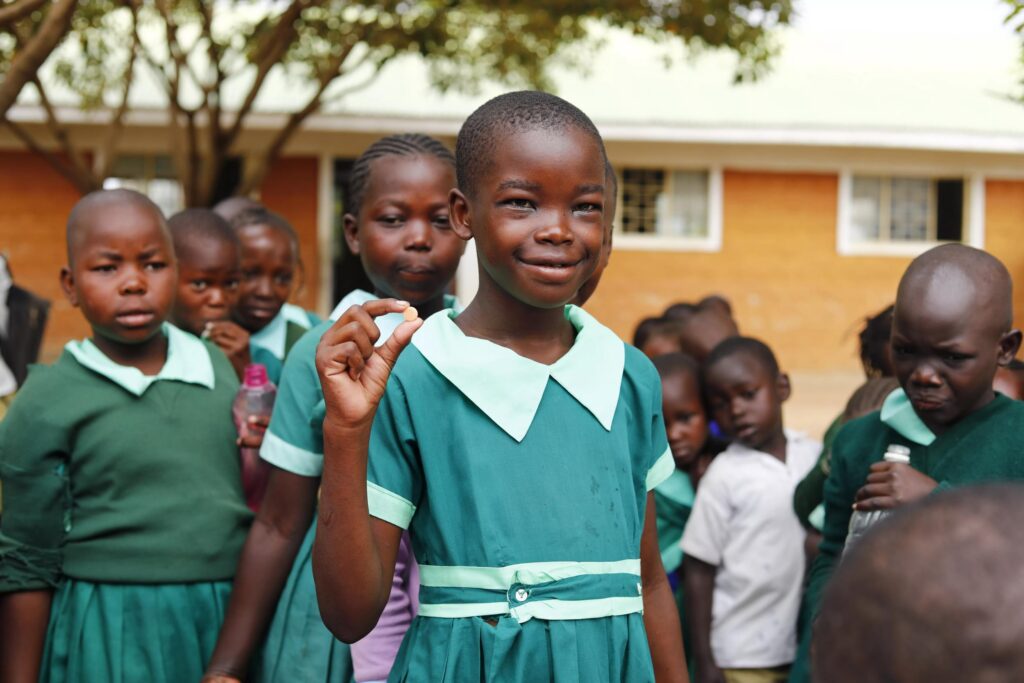
In 2025 you helped us distribute
Stories of Changed Lives

HEALTH
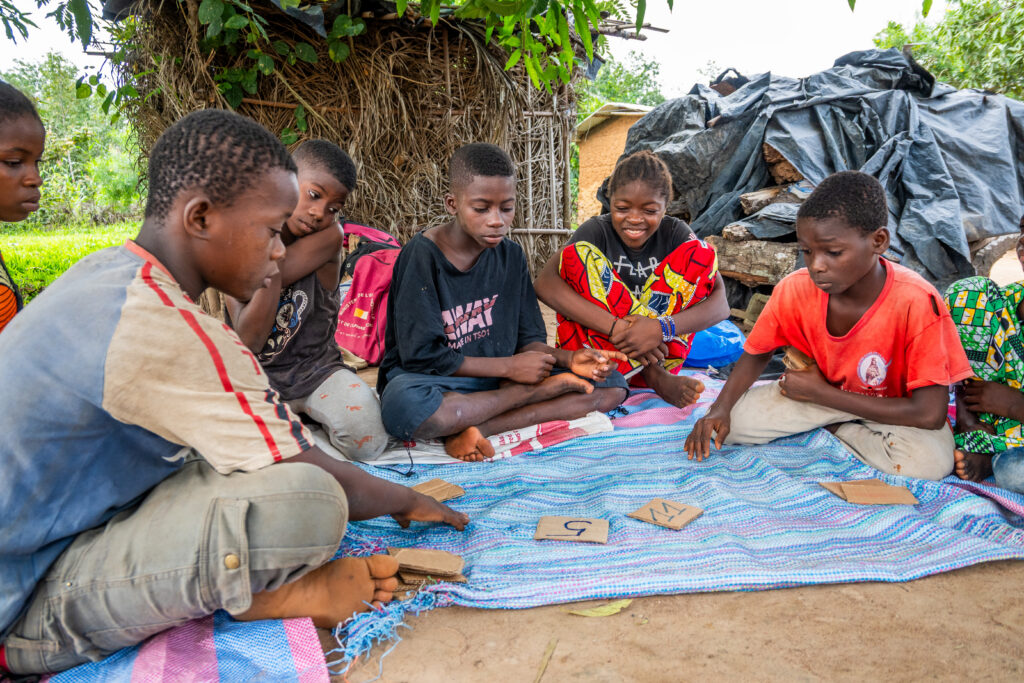
Kanishka, a fourth grader in Vrindavan, India, was always stumbling and bumping into things. Her family never suspected poor eyesight. During a school screening by Seva partner Dr. Shroff’s Charity Eye Hospital, she was diagnosed and fitted with her very first pair of glasses.
The difference was immediate. Kanishka now enjoys drawing, painting, and playing with her little brother. Her favourite subject is math, and she dreams of becoming a teacher one day.
She simply needed someone to look closely enough to see what was wrong. Seva Foundation’s school screening programs do exactly that, reaching children whose families would never know to look.
Thank you to the 2,540 donors
who helped fund our operations in 2025.
For every $1 dollar we spend on operations, we raise $9.19 dollars for our recommended charities.
Amplify your giving by donating to The Life You Can Save itself.
Donate to The Life You Can Save
2025 Annual Report Financials
Our Key Metrics: Net Impact and Leverage Ratio
Our key performance metrics are “Net Impact” and “Leverage Ratio.”
Our “Net Impact” takes the money we raise (i.e., our “Money Moved”) and subtracts our operational expenses from that figure. Our “Leverage Ratio,” by comparison, takes our Money Moved and divides that number by our expenses. We typically talk about our Leverage Ratio over a three-year period (money moved over three years divided by expenses over three years) because it can be volatile over a one-year period.
Both metrics compare the amount of money we raise for our not-for-profits to the money we spend operating our organisation. We believe they are best considered together, but we view Net Impact as the more important single measure because it captures our absolute, real-world impact on the lives of people living in extreme poverty. Our primary goal is therefore to maximise Net Impact while maintaining a reasonable three-year Leverage Ratio.
To illustrate, we would far rather move $90 million to our recommended charities while spending $10 million to do so (Net Impact of $80 million; Leverage Ratio 9:1) than move $100 in total while spending $1 (Net Impact of $99; Leverage Ratio 100:1).
The latter is efficient but achieves little real-world impact. That said, we believe our Leverage Ratio (which we also refer to as our “Multiplier”) is an important metric because it captures the efficiency of our operations.
And we recognise that our Leverage Ratio is an intuitive and meaningful metric for many supporters who donate to fund our operations, one that helps supporters understand the “multiplier” they get on their gift. For instance, by applying our 3-year Leverage Ratio of 9.19:1 to a gift of $1,000, a donor could expect that donation to help us raise $9,190 for our recommended not-for-profits.
We believe that both Net Impact and Leverage Ratio are conservative measures of our impact. This is because we know the Money Moved metric used to calculate both metrics doesn’t account for all the donations we may have inspired. While we can measure donations that flow through The Life You Can Save, our ability to track donations that we influence that are made directly to our recommended not-for-profits is much more limited. We rely on our not-for-profits to track those donations, and many of our not-for-profits have limited ability to do so.
A donor survey we send out helps fill some, but not all, of the gaps in our data. We’re confident that we’re still missing some donations made directly to our not-for-profits. We’re also confident that we’re undercounting donations that we influence where foreign donors give through intermediaries that allow them to claim tax relief.
Even if we could perfectly measure donations made to our recommended not-for-profits, our key metrics would still understate our impact. They assign no value to donations that we influence to effective not-for-profits that aren’t on our list of recommendations, and they don’t capture non-monetary influence like motivating people to use their careers for social good.
The Life You Can Save Financials 2025
View financial information here.
Money Moved 2025 – What’s Included?
In the ‘Money Moved 2025 – What’s Included’ appendix, we provide a detailed account of our total “Money Moved” (i.e. the total donations to our recommended not-for-profits that we either processed directly or influenced) and our operating expenses. We view these figures as a helpful supplement to the standard regulatory reporting measures commonly used to conduct financial analyses of not-for-profits (ex. the Form 990 in the US and statements filed with the ACNC in Australia).
Please note that the figures provided in this Annual Report may at times differ from those provided in official financial records for a few reasons:
- Global results vs. National Results: In our Annual Report, we aggregate the money moved and operating expenses of The Life You Can Save (a US-based not-for-profit) and The Life You Can Save Australia (which is a registered charity in Australia) in order to assess our overall global impact. Technically speaking, however, “The Life You Can Save (US)” and “The Life You Can Save Australia” are separate legal entities subject to different reporting requirements imposed by their respective jurisdictions. As such, their official records will be separate.
- Revenue for our recommended charities vs. Revenue for The Life You Can Save itself: Our official income statements include two different types of donations we receive: 1) donations given to The Life You Can Save itself for our own operational expenses and 2) donations made through The Life You Can Save and granted by us to one or more of our recommended not-for-profits. Our grants are officially recorded as “expenses” and “program costs” in our financial statements in the US and Australia respectively, but to best understand our financial status, it’s important to distinguish between this granting activity and our operational spending.
- Donations processed vs Donations influenced: When calculating our total Money Moved to our recommended charities, we include both donations that we process directly as grants and donations to our charities (either directly or through a third party such as Network for Good or other intermediaries) that our outreach inspired or influenced in some way. Since our official financial statements only record funds directly processed by our own organisation, they reflect most, but not all, of our total Money Moved.
For stakeholders interested in reconciling the figures in this Annual Report with those provided in our official financial records, this document offers additional details.
Money Moved 2025 – By Charity
This table offers a snapshot of the Money Moved—amounts raised—for each recommended charity in 2024. It excludes donations from foundations and individuals who have requested that the designation of their contributions remains confidential.

